Leaderboard
728x15
Showing posts with label health care costs. Show all posts

Rising Healthcare Costs: Delayed or Defeated?

Ready, set......
According to this just-published New England Journal article, analysts are still waiting for the twin forces of 1) an improving U.S. economy and 2) higher numbers of newly insured Americans to reignite healthcare inflation.  While the latest data from the Bureau of Economic Analysis (BEA) are conflicting, data from the early part of 2015 suggests that health costs are remaining tame.

What gives?
 
While many Obamacare supporters say this is more evidence of Washington's central-planning genius, author Charles Roehrig notes other factors be at play, namely:

1. The 9 million of 2015's newly insured amounts to 3% of the U.S. population. Their baseline spending was probably half of normal, so the resulting increase would expand the nation's spending by a modest additional 1.5%.  Since this group is younger, it'll likely be less than that.  Their contribution to increasing costs will be harder to detect.

2. What's more, insurance enrollments were finalized relatively late in the year, so these newly insured haven't had much of a chance to give their new benefits an early test-drive.

3. The first quarter of 2015 was an unusually cold winter. The Population Health Blog recalls how freezing temps, wind and snow made for a relaxed day at the clinic. Multiply that across millions of newly as well as long-term insured people, and it adds up.

4. Yes, stupid, it is the economy, which has a strong correlation with healthcare spending. Loss of health insurance thanks to unemployment, declining tax revenues that pressure government insurance programs to limit eligibility as well as benefits, employers' unwillingness to go along with otherwise automatic benefit increases and a general unwillingness of consumers to open their wallets in recessionary times has also added up.

5. Thanks to the expiration of some patents, prescription drug spending moderated.

Bottom line: all of the above are one-time impacts.  The economy's impact and new access to insurance are lasting fundamentals that will not go away. It's too soon to tell what is really going on.
 
The PHB will stay tuned.

A Medical Education Bubble Portends Lower Health Care Cost Inflation?

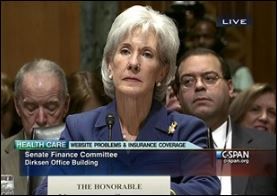
The Disease Management Care Blog spent part of its day in front of its internet enabled World Headquarters' computer screens. As a result, it was able to tune into todays dreary Sebelius Senate Finance Committee testimony.

It wish it hadn't. Between the spin, gotcha's and speechifying, it's obvious that the political rancor is here to stay. And in the end, it makes little difference who is "wrong" or "right" about Presidential reinterpretations of the history about "keeping your plan" or some regulation about "grandfathering." What is more disconcerting is how the partisan divide is gumming up the gears of a well-intentioned if flawed piece of legislation that is now hitting one fifth of the U.S. economy.

Which makes this New England Journal article on the possibility of a "medical education bubble" so timely. According to David Asch et al, "bubbles" occur when a product (in this case the training to be a practicing physician) far outstrips the underlying economic demand (i.e., physician services). Based on this chart that trends medical educational debt to income, student debt has gone up, while future income potential is stalling. In other words, there is a growing disconnect between what physicians can charge patients and what medical schools are charging their students.

The DMCB was not surprised at the rising cost of medical school and financial sacrifices necessary to do a residency, but it was less aware of how slowing health care costs are playing out in our nation's medical schools.

The good news is that this bubble is another indication of slowing health care inflation.

Most agree that the individual insurance market was broken, Medicare's expenses remain ultimately unsustainable and Obamacare will continue a long-established trend of making consumers assume a greater share of health care costs thanks to significant out-of-pocket expenses. The bubble phenomenon suggests we may be getting a handle on that.

Bad for medical schools, but good for the country - especially since the tenor of today's hearing suggest Congress is unlikely to come up with any new solutions in the near term.

Health Care Cost Insights and Capitation for the Patient Centered Medical Home (PCMH)

The Population Health Blog finally caught up with the Oct 22/29 "Price, Cost and Competition" issue of JAMA

One of the more interesting articles was a Viewpoint editorial on the Patient Centered Medical Home (PCMH). After tut-tuting fee-for-service payment as antithetical to meaningful payment reform, the author admits what the PHB has been saying all along: a global payment that covers all the medical, coordinating as well as non-physician services of the PCMH is tantamount to old fashioned "capitation." As we learned in the 1990s, capitation's unintended consequences are a) signing up too many patients, b) limiting access to primary care and c) over-referring to specialists.  To counter that, the editorial's author suggests the PCMH movement seeks "accountability." 

We'll see about that.

In the meantime, some other interesting articles:

Are "for-profit" hospitals evil?  Not necessarily.....

237 hospitals that converted from not-for-profit to for-profit anytime between 2003 and 2010 were compared to 631 hospitals that had not converted.  Converting hospitals improved their financial margins (practically all were in the red and subsequently became break-even) vs. the comparison group, and did so without increased utilization, restricting access to care, higher death rates or declines in quality for their Medicare patients. Their path to profitability may have been lined by renegotiated commercial insurance contracts, cutting costs or moving non-performing assets off the balance sheet.

Can physician groups become monopolistic? In a word, yes.

Commercial insurance preferred provider organization (PPO) charges for ten types of physician office visits in ten different specialties across 50 states were correlated with a measure of local market dominance dubbed the "Hirschman-Herfindahl Index" (more on that here).  As the HHI index increased, payments also increased, suggesting that as much as additional $3 to $12 in fees for the same services were the result of monopolistic contracting.

Monopolies aside, if docs are in charge vs. the hospitals, can they reduce health care costs?  Also yes.

This study compared average "per-patient expenditures" of physician-owned versus hospital-owned integrated medical groups and independent practice associations in California from 2009 to 2015. Among the 158 groups, 118 were owned by docs; their expenditures were over a thousand dollars less compared to hospital owned groups.  Larger physician groups had higher expenditures than the smaller ones.  More on that in a future post.

Does price transparency help patients chose to spend less?

Over 500,000 insurance plan enrollees had special on-line access to prices for medical services prior to using them.  There were over 250,000 households and of these, approximately 7500 accessed the information. Compared to households that didn't check the information, the price-shoppers seemed to choose cheaper labs (a few dollars per test) and imaging options (about a hundred dollars per test).  In looking at the data, the DMCB suspects some may have also deferred testing by choosing to use them less frequently or not at all.

The (Irresistible) Rise of “Shadow” Cost-Effectiveness Analysis?

The shadow knows.... more
The Disease Management Care Blog continues to welcome blog posts from outside authors. This one is courtesy of Erik Tollefson, who works in the health policy field. He can be reached at erikDOTmDOTtollefsonATgmailDOTcom.

Although public and private health care payers officially eschew the use of formal cost-effectiveness analysis in approving medical treatments, a growing number of examples illustrate that cost-effectiveness principles are seeping into medical decision-making. Indeed, Memorial Sloan Kettering Cancer Center decided not to give patients Zaltrap (a drug) for late-stage colorectal cancer due to cost concerns; at least three health insurance companies, including most recently Blue Shield of California, have decided not to cover proton beam therapy for early-stage prostate cancer due to its high price.

These decisions symbolize that “shadow” cost effectiveness analysis, whereby payers make informal value calculations based on the price and efficacy of a treatment, may become an increasingly common feature of the payment landscape. 

It should be noted that payers have likely made similar calculations during initial coverage decisions: health insurance companies and hospitals have historically negotiated with drug makers and medical device manufacturers on price and value compared to existing treatments. Blue Shield California, however, has agreed not to cover proton beam therapy any longer due to cost concerns, although that reasoning is not complete: the decision is based on the therapy’s inability to demonstrate equal or better outcomes, while boasting a price tag several times above the benchmark treatment modality.  As Marcus Thygeson, the senior vice president and chief health officer at Blue Shield of California, stated in a letter to oncology and radiology practices in the state:

“The preponderance of medical evidence clearly shows that the treatment has about the same clinical outcomes as other forms of radiation, but it's a lot more expensive…because it's not cost effective, we're not going to cover it."

The rise of shadow cost effectiveness analysis is not surprising in the current economic environment.  While there are still strident concerns regarding overall spending on medical care, even as cost growth has moderated during the recession, substantial pressure exists at the firm level (e.g., insurance plans and hospitals) as margins compress and risk-sharing agreements increase.

The fragmented nature of the nation’s public-private health care payment system has also contributed: Medicare, one of the largest and most influential payers, cannot reject coverage of medical treatments explicitly based on cost due to restrictions in the program’s enabling statute. This puts the onus on private payers and hospitals to exercise greater authority in the rejection of expensive, innovative treatments with limited efficacy; traditionally, however, this power has not been aggressively exercised, leading to coverage of treatments that might only provide marginal benefit.

This schism in payer assessment of treatments in the US where private insurance plays the leading role is unlike that found in other industrialized countries where public payers play the dominant role: In the UK NICE decides which drugs or medical devices meet the “cost-effective” threshold for coverage by NHS via systematic cost-effectiveness analysis. This process makes a palpable difference in the availability of treatments: While there are currently 12 proton beam therapy centers in the US (with numerous more planned), there are currently none in the UK; the first two centers are planned to come online in 2018. 

Overall, there are both positive and negative elements to the emerging phenomenon of shadow cost-effectiveness analysis. First, the discussion of tradeoffs between cost and outcomes of medical treatments is notably more productive than the prevailing focus on merely “constraining costs.” Indeed, a medical delivery system that focuses on cutting costs, but does not focus on the actual value of treatments, is literally one of little value. Second, the use of rudimentary cost-effectiveness principles calls into question what actually constitutes “innovation” in the medical space, and may give pause to the inevitable “arms race” that follows coverage decisions.  Indeed, if insurance companies continually reassess (and reverse) coverage decisions based on emerging clinical evidence, it may lead to better medical decision making.

On the negative side, shadow cost effectiveness has limited efficacy without a full array of analytical tools. That is, while it is useful in assessing (and stopping) egregiously non-cost effective interventions, it is less effective in dealing with similarly valueless interventions that may have similar efficacy as existing interventions but cost marginally more or less.

Image from Wikipedia

Are Rising Health Care Costs As Bad As We Think They Are?

When pundits claim that health care spending is out of control, what do they mean?

Does it mean that Massachusetts' outlawing of hospitals' excessive price increases is a good thing? That rolling back the Affordable Care Act will automatically usher in a new round of price gouging? That when the DMCB generates another medical co-pay, the DMCB spouse is right to wave a copy of the bill around and demand that the DMCB do something now to reform the U.S. health care system?

As the Disease Management Care Blog understands it, what the pundits, Massachusetts legislators, patient advocates and the DMCB spouse mean is that more and more of our nation's gross domestic product (GDP) is being spent on health care services.

That assumes we'd all be better off if the U.S. were spending its national treasure on stuff like manufacturing, technology, education and innovation. So, instead of committing just under 18% of our output on hospital care, physician services, nursing homes, medical devices and drugs, we'd all be better off if we spent it on the production of solar panels, Facebook, public school vouchers and iPhone apps.

That way we wouldn't be struggling with the prospect of another 1% gain on GDP (to 19%) and the looming possibility that we'll soon be spending a whopping fifth of our economy on health care.

But is the spending on health care really that bad?  As noted here, the DMCB pointed out that non-government-insured health care costs have been moderating for years.  What's more, recent year-to-year increases in health care spending in the U.S. are actually lower than much of the developed world.

And now there's one more reason to doubt the prevailing wisdom about rising health care costs. Charles Roehrig, Ani Turner, Paul Hughes-Cromwick and George Miller of the curiously name Altarum Institute point out that the normally rising and falling GDP associated with routine economic cycles can make steady health care costs look relatively worse or better than they appear.

To dampen the impact of a cyclic economy on the assessment of health care spending, the authors compared health spending to U.S. "potential GDP." Apparently, this obscure economic metric has been used by economists to portray what GDP would be if the economy were operating at full employment of the current population and without any idle production capacity.  This metric has the advantage of "smoothing out" many of the peaks and valleys of the normally measured GDP.

Using potential GDP as the comparative baseline, the authors found that health care spending growth gained less than 1% of the economy starting in July of 2005, well before the onset of the Great Recession of 2008In other words, during that time, the health care industry grew pretty much at the same rate as the "potential" GDP. 

What's more, in June of 2009, health care cost growth gained an additional 1% of potential GDP, only to fall back below 1% again in May of 2011.  Most of the increases seemed to be accounted for by Medicare Part D spending; if that particular cost is backed out, excess growth would have been 1% or less throughout the measurement period.

The authors can only hypothesize on why health care costs didn't outstrip the U.S. economy. While it could be partially accounted for by the rising numbers of uninsured (who would have avoided going to hospitals or seeing doctors), the authors point out that other trends could have played a role: changing physician practice standards, increasing numbers of salaried physicians, market pressures pushing down on fee schedules, increases in patients' out-of-pocket expenses making them less likely to access the care system, new care models (including disease management?), the increasing use of generics, previously expensive drugs going off patent and the drop-off in the number of "blockbuster" pharmaceuticals.

This means when the economy bounces back and/or Obamacare results in more insured Americans, there is no guarantee that underlying health care inflation will return.

Do Employer-Based Wellness Programs Work?

Reuters tackles worksite wellness outcomes
Mrs. Smith (name changed) was overweight.  She knew it and her physician, the Disease Management Care Blog, knew that she knew it.  Since the DMCB was one of the two persons on the planet who knew her true weight, she could talk to it behind closed doors about diet, exercise, fads, over the counter meds, prescription appetite suppressants and even bariatric surgery. 

What the DMCB quickly discovered was that Mrs. Smith's weight-loss goals were not only unrealistic but, like many women struggling with weight, driven more by the prospect of how she'd look in a bathing suit than any real health benefit.

Mrs. Smith wasn't alone. This seminal study demonstrated just how unrealistic women's weight loss goals (in the range of 50 lbs.) can be.  Think of the popularity of The Biggest Loser and it's easy to see why persons think thinness is just a matter of a few months of dieting and exercise, and that being skinny leads to health and happiness, 

Easy, right?

DMCB readers know otherwise. That's why they're not going to be impressed by the tone of this May 24 Reuters article on worksite wellness.  RAND, in a not-quite released report to Congress, examined the impact of several employee based programs and found, in the words of the Reuters reporter, only a "modest effect."  Average weight loss was "only" three lbs., tobacco cessation rates were significant but "short term," average cholesterol levels were unchanged and reductions in health insurance claims expense failed to achieve statistical significance.

Researchers have known for years that conservative dietary and lifestyle therapy typically results in weight loss in the range described above. In addition, cholesterol reduction as a primary prevention intervention is low yield when it comes to health. On the other hand, even short term tobacco cessation is a good thing. When it comes to the ability of wellness to reduce health care costs, weight reduction is unlikely to drive claims expense for a health insurer within two to three years, the impact of obesity on overall mortality rates is not as large as you'd think and "prevention" rarely saves money.

What's more, these programs were able to achieve their "modest" outcomes without increasing claims expense.  Participants lost weight and stopped smoking at no additional cost to the system.  Now that is something.

Mrs. Smith and Reuters are very similar.  Both are struggling with nrealistic expectations thanks to dubious fashion trends, media misinformation and scientific ignorance.  Fortunately, Mrs. Smith had access to a resource that could help her better manage her weight.  The DMCB can only hope that Reuters has access to a resource that can help it manage its lack of background knowledge.

The Commonwealth Fund Keeps Score on U.S. Healthcare: Less Here Than Meets the Eye

YOU are in last place!
According to news reports on the Commonwealth Fund's comparison of the United States' healthcare to other developed countries, we are the sick man, on a losing streak and dead last

Ugh.

Just when the U.S. prevailed against Ghana in the World Cup, we have to deal with being called a loser.

Naturally, the Population Health Blog decided to investigate.  It discovered that the Commonwealth Fund ranked the U.S. against 10 other countries using a combination of multiple outcome measures. 

Here's the complete report

What does it actually say?  Rather than attempt to summarize the report's findings, the PHB provides some telling quotes:

Quality:

"The United Kingdom ranks first and Norway last on quality, based on averages of the scores in these four areas. The U.S. falls in the midrange on this domain of performance."

Preventive Care:

"The U.S. does well in providing preventive care for its population. Respondents in the U.S. were more likely than those in most other countries to receive preventive care reminders and advice from their doctors on diet and exercise."

Effective Care:

"The U.S. is third on effective care overall, performing relatively well on prevention but average in comparison to other industrialized nations on quality of chronic care management."

Safety:

"These findings indicate that the United States has improved on safety indicators.... For example, the U.S. now leads all nations with a relatively low number of sicker patients reporting an infection during a hospital stay or shortly after."

Care Coordination:

"Eighty-three percent of American patients had arrangements for follow-up visits with a doctor or other health care professional made for them when leaving the hospital, second only to the United Kingdom."

Patient Centeredness:

"The U.S. ranks fourth. All countries could improve substantially in this area."

Engagement and patient preferences:

"The United States did well on most indicators."

So, since the United States is doing well on quality, preventive care, effective care, safety, care coordination, patient centeredness as well as engagement and patient preferences, what's the problem? 

Again, some quotes:

Americans .... reported negative insurance surprises and the highest rates of serious problems paying medical bills.... On indicators of efficiency, the U.S. scores last overall with poor performance on the two measures of national health expenditures, as well as on measures of administrative hassles, timely access to records and test results, duplicative tests, and rehospitalization.

Americans with below-average incomes were much more likely than their counterparts in other countries to report not visiting a physician when sick; not getting a recommended test, treatment, or follow-up care; or not filling a prescription or skipping doses when needed because of costs.

The U.S. ranks last on mortality amenable to health care, last on infant mortality, and second-to-last on healthy life expectancy at age 60.

Plus this tidbit.....

Disparities in access to services signal the need to expand insurance to cover the uninsured and to ensure that all Americans have an accessible medical home.

The PHB's take?  There is less to this than meets the eye:

1.  The United States performs well on a majority of overall quality measures.

2.  The United States suffers from high overall costs

3.  The Commonwealth Fund's ranking system faults the U.S. on two levels:  value (our high quality comes at a very high price) and equity (persons with lower incomes cannot afford to access our high quality system).  Add up the points in this scoring system, and the U.S. is last.

4.  The Commonwealth Fund uses data from prior to the 2015 implementation of Obamacare, which was specifically designed to address the United States' shortfalls by subsidizing commercial insurance and increasing Medicaid enrollment.

5. By the way, despite little evidence in the report that cost, value or access are necessarily increased by the U. S. version of the medical home, the Commonwealth Fund included it anyway.

How well will all those high out-of-pocket "bronze plans," Medicaid, Accountable Care Organizations and the medical home truly reduce cost inflation, enhance value and increase access? 

Stay tuned.  The PHB is looking forward to seeing how they'll rank Obamacare's impact in 2015.

Does ANYONE Really Know Projected Health Care Costs? Nope!

You sure about that?
According to the White House, the Affordable Care Act (ACA) is obviously responsible for the significant decrease in health care cost inflation over the last three years.
The respected health economist Victor Fuchs, writing in the New England Journal, disagrees.  He points out:

1) there is a strong relationship between growth in the U.S. gross domestic product (GDP) and growth in health care spending: for the last 60 years, when one goes up, the other follows suit.  While the prevalence of illness drives the consumption of health care, it turns out that the prevalence of illness plus a rising income is a stronger driver of health care consumption*.

It's far more likely that the lackluster economy has been responsible for the low rate of inflation.

2) Two to three years is not enough time to guage the impact of any single intervention on health care spending. In his NEJM article, Dr. Fuchs presents a graph showing the relationship between a two year period of spending and what follows over the next twenty years.  It turns out it's a very poor predictor.

So, even if the ACA could have an impact, it's far too early to tell.

In the meantime, skeptics like Bob Laszewski, are pointing to richer mandated insurance benefits and are confidently predicting that health care costs are destined to increase.  Former CBO Director Douglas Holtz-Eakin worries young healthy adults won't sign up, which could further fuel health insurance premium increases.

Who to believe?  A partisan White House?  Skeptics who want a return to market-based insurance?  The DMCB's solution is to believe Dr. Fuchs and confidently state it doesn't know which way things are going to go.

*The only exception to the association between GDP and health care costs was during the mid-1990's when managed care had its stranglehold on the delivery system

Image from Wikipedia

A Thursday Three-fer: Diabetes Predictive Modeling, The Threat of Ambulatory Care Write Offs and It's the National Debt, Stupid!

At Risk?
Diabetes Predictive Modeling: Evidence Based, Peer Reviewed and Open Domain:

As Accountable Care Organizations, Patient Centered Medical Homes, care management vendors and managed care organizations continue to grapple with health care costs, they want to know who is at greatest risk in the coming months.  When it comes to diabetes mellitus, John McAna and colleagues (one of whom is the Disease Management Care Blog) is riding to the rescue with their American Journal of Managed Care paper "A Predictive Model of Hospitalization Risk Among Disabled Medicaid Enrollees." 

While the data were based on two states' Medicaid claims data sets, the research may be generalizable to other populations.  Factors that most strongly predicted a future hospitalization were increasing age (especially more than 65 years), a prior pattern of repeated hospitalizations (especially 3 or more) and the Charlson Comorbidity Index. The good news is that all the independent variables and their odds ratios are not-only evidence based, they're available for use by your actuaries and statisticians as quick as you can download the paper (after signing in) at the bottom of page 4.

Rumored Ambulatory Care Write-Offs: An Achilles Heel of Integrated Delivery Systems and ACOs?

In its recent travels, the DMCB was informed by two credible and astute physician-leaders that hospitals that have recently acquired outpatient physician practices are typically "writing off" ambulatory care bills because a) contesting small fee disputes are relatively costly and b) the threat of Medicare "overcharge" or RAC audits is existential.  That's significant because those small charges add up into millions and can mean the difference between a profitable outpatient clinic system and a loss leader.

It's Not the Economy, It's Not the GDP, It's the National Debt, Stupid:

The DMCB also recalls repeatedly hearing that it was President Nixon who first called attention to the growing fraction of the nation's gross domestic product going toward health care. The problem was that no one knew what was the "right" percent of GDP.  Mr. Nixon thought 7% was too high. If 7% isn't, in retrospect, bad, why is the current level of about 18% so bad?  What's so different?

The answer: it really is different this time.  What's bad is that health care is responsible for the lion's share of the separate problem of the growing national debt, which has been directly linked to national security.  Yikes.

Over Four Million Dollars to Save a Life?

Enjoy the ride!
Lebron James fan Jason Shafrin of the Healthcare Economist blog hosts the latest edition of the Health Wonk Review.  It's not only fit for a king, it's also fit for any student of health policy that wants unique insights unavailable anywhere else. 

Lots of learning with links can be found here.

The Population Health Blog's recent post on the life-saving attributes of health insurance is included in Jason's Review.  In it, the PHB points out that mandating coverage for 830 persons to save one life is not welcome news.

Docs like the PHB conventionally (and arbitrarily) believe that a reasonable "number needed to treat" (the number of patients that have to be exposed to a treatment in order to achieve a successful outcome) is less than a hundred.  Start going higher than that, and we begin to worry that the treatment may be worse than the disease.

Attach dollars to it and the number becomes even more telling.  Assuming an average health insurance policy "costs" $5000 per year, that's a back-of-the envelope cost of $4.15 million per life saved.  While the PHB would be the first to point out that every life is precious, that falls outside usual assessments of cost-effectiveness.

Bottom line?  These data suggest that we can save lives by mandating insurance, but there is no free ride.

In fact, this one is gold plated.

Image from Wikipedia

Warning: Health Insurance is Hard

As a former commercial medical director, the Disease Management Care Blog has wrangled with a number of physician colleagues in the population health, medical home and accountable care business on the basics of health insurance .

Many are afflicted with two "insurance-is-easy" conceits:

1. Insurers take in premium money, pay claims and keep what's left over, and

2. Quality health care means more money is left over.

Both have fueled the Accountable Care Organization (ACO) gold rush. Since insurers are supposedly fat with money, it's a no-brainer to want to get a piece of the action, especially since "stuff" like mammograms and the electronic record will save even more bucks.

Win-win, right?

Not so fast.  Insurers' ROI is not huge, quality costs and the EHR's money-saving potential is just that.

Which is why the DMCB likes the short American Journal of Managed Care manuscript on ACOs that asks "Is the Deal Any Good?"

Author François De Brantes reminds readers that 1) a lot of patients are needed to dampen the individual impact of costly outliers, and 2) certain assumptions must be made about cost trends.  Get either wrong and you could lose money.

The author also asks readers to consider the achievable savings rate. To the DMCB, this speaks to the assumption that quality and prevention automatically add to the bottom line. That's not necessarily true and could make you lose even more money.

Says the author:

Over a decade ago, the ability of providers to understand the uncertainty of the financial risks eventually led to the demise of many and a significant setback for the country in our collective ability to rein in runaway medical costs. We cannot allow the same mistakes to happen again, and both providers and payers need to understand whether or not the deal is any good.

In other word, insurance is hard.  Stay tuned on whether the ACOs have figured that out.

Diabetes Control and Lower Weight Is Associated With Statistically Significant Savings

A complication of diabetes
The study is reported here in the American Journal of Managed Care.

Researchers at the western Massachusetts Reliant Medical Group were interested in knowing whether there was any association between control of blood sugar among persons with diabetes and their health insurance claims expense. Using combined data from their electronic health record (EHR) plus insurance claims, they identified all (continuously enrolled) adults with at least one physician encounter between January 2007 through December 2011 for a diagnosis of diabetes, who also were being treated with metformin and a sulfonylurea drug.  This yielded a population of 2044 patients.

This study had some useful benchmark data for other providers with caring for a similar diabetic population. 27% had an A1C goal of less than 7%, 64% had an A1C goal of less than 8%, 33% had a blood pressure less than 140/90 mm Hg, 68 % had a LDL of less than 100 mg/d, and 34% had a body mass index (BMI) less than 30.

After controlling for age, gender, enrollment date, race, payer type and comorbidities, the researchers found that having a target A1c less than 7% (indicating good diabetes control) was associated with $992 per member per year (PMPY) in savings. There were $1445 PMPY in savings for an A1c less than 8%, and $1218 for a BMI less than 30 - all versus persons who did not achieve those goals.  Just controlling blood pressure, or cholesterol levels did not result in statistically significant savings  

Combining a low A1c, blood pressure control less than 140/90, low LDL cholesterol and BMI in various combinations seemed to result in savings in excess of $2000 per member PMPY.  Most of the savings related to diabetes control appeared in the outpatient category, while most of the savings related to BMI appeared in the inpatient category.

The DMCB's take:

1. Not all persons with diabetes may have a "diabetes" diagnosis in the EHR or a bill submitted to an insurance company that uses that particular code. The DMCB likes this study because it's more likely that a person with diabetes will eventually show up in a 5 year period. Plus, the use of metformin and a sulfonylurea medication makes it easier to accurately capture persons with diabetes.

2. This is another in a series of observational studies that infers that persons with target control of blood glucose or who are not overweight experience lower claims expense compared to persons with poor control or who are overweight.

3. What this study does not prove is that blood glucose control or weight control causes low insurance claims expense.  Association does not equal causality any more than "white hair" causes heart attacks.  In order to prove causality, persons with diabetes and similar baseline claims would need to be randomly allocated to good vs. bad control of their blood glucoses (or good vs. bad weight) with prospective and simultaneous comparison of the future expenses over time.  That's called a randomized controlled trial.

4. Remember the ACCORD study?  Persons were randomly allocated to tight vs. very tight control of their blood glucoses and the death rate unexpectedly causally went up for persons with very tight control. The DMCB brings that up because, in the AJMC study described above, less tight control of diabetes (A1c less than 8% vs. the target of 7%) was associated with even greater reductions in claims expense.  Is this further evidence that tight control of diabetes leads to problems?

5.  Unexpectedly, blood pressure or LDL control was not independently associated with lower claims expense.  That's important because Accountable Care Organizations that assume blood pressure and cholesterol lowering pill compliance will result in shared savings may need to reconsider.

Ultimately, while this study doesn't prove that successful population health management for diabetes would save money, it's one more piece of evidence pointing in that direction.  Let the studies continue.

Medicare's Expenses Increased by 0.4%? Really? And It's All Because of the Affordable Care Act?

If you're the head of Google and you want to teach about the internet, North Korea is a swell place to visit.  If your goal is air travel safety, the 787 Dreamliner is the plane for you.  If you would like to get the puck from an opposing professional hockey player, saying "please" helps.  And if Medicare costs dip, the Affordable Care Act (ACA) obviously deserves the credit.

Writing on an HHS website, Richard Kronick and Rosa Po announce that 2015 Medicare expenditures per beneficiary grew only by 0.4% over the 2011 baseline.  They credit the ACA's value-based payment (VBP) system, attacks on fraud and abuse, reduced payments to Medicare Advantage plans, cutting hospitals payments and "innovation."

The Disease Management Care Blog isn't too sure about that.

1. This Kaiser Health News article notes the VPB program withholds 1% of hospital payments and uses that fund to award bonuses in what is really a zero sum game.  And this Health Affairs article suggests the overall financial impact of VPB on hospitals is quite minimal anyway. 

2. While there have certainly been some big fraud and abuse busts, there's plenty of reason to still be skeptical about the ability of Medicare's ossified bureaucracy to catch up with the sophisticated criminal enterprises that are routinely fleecing billions from the U.S. taxpayer.

3. As for the one-time payment cuts to providers and insurers, the DMCB is confident that they'll figure out ways to get their money back.  They always do.

4. The innovations are in demonstration phase.  It's too early to tell.

In addition, the DMCB is surprised that Medicare's 2015 insurance claims were ready to be rolled up and quantitated in early 2015. Check out this telling quote from the website:

"2010 and 2011 statistics are calculated on a calendar year incurred-basis. 2015 statistics are calculated on a fiscal year cash-basis, because calendar year incurred-basis data are not yet available." (bolding from the DMCB).

Last but not least, the DMCB believes the lackluster economy has probably had the biggest impact on consumers' willingness to use their Medicare benefit.  While Kronick and Ro state" Medigap" insurance benefits have protected the beneficiaries from the financial pain of Medicare's out-of-pocket expenses, the expense of using a hospital or seeing a doctor is more than the sum of all those medical bills.

Is the DMCB being too skeptical?  Perhaps, but this particular HHS spin is built on assumptions that are backed by associations that are biased by partisan loyalty.  Taxpayers deserve better.

Image from Wikipedia

Seven Things You Need to Know About 2011 Health Care Spending

If you're interested in learning more about the latest U.S. health care cost trends, everything you need to know is in this article in the January 2015 issue of Health Affairs.

Or you could rely on the Disease Management Care Blog to point out the article's 7 most important points.  Use them to impress your colleagues and stymie your foes:

1) The data only go up to 2011; we'll have to wait another year before we'll know about 2015.

2) 2011 health care spending, as a percent of gross domestic product, remained at 17.9%.  The overall economy was slow and that took its toll on the health care sector.

3) That comes out to $2.7 trillion or $8,680 in health care spending per person.

4) While the percent remained stable, the economy experienced modest growth in 2011. The health care sector, thanks to an overall growth rate of 3.9%, kept pace. Prices for services grew less than the demand for services.  As we grow older, demand is likely to grow.

5) Medicare and private insurance grew faster than the economy, which was offset by Medicaid cost cutting by the states.

6) If the past is any guide, when the U. S. economy rebounds, health care spending is likely to accelerate and resume its march toward becoming 20% of GDP.

7) The relative stabilization of 2011 health care costs is independent of the Affordable Care Act.  Many of its important provisions (such as the mandate) don't kick in until 2015.
Leaderboard